Amylose content (AC) in rice grains is a relevant parameter for predicting pasting properties of cooked rice as it is often used for a tenderness prediction. We will perform experiments to measure the AC in different types of rice grains commonly used in risottos, such as carnalori, arborio or vialone nano. For that purpose we will:
1. Isolate starch
A wide range of methods are available for isolation of starch from rice. They are grouped into three categories: alkali isolation, acid isolation and water isolation. The main objective of the alkali and acid methods is to separate proteins and lipids from starch. However, as omitting the defatting of the rice doesn’t influence the amylose content, we will use for simplicity the water steeping method.
The flow chart bellow was built for corn flour, therefore, this will be considered only a guide for our experiments and probably during the experiments we will slightly vary some settings.
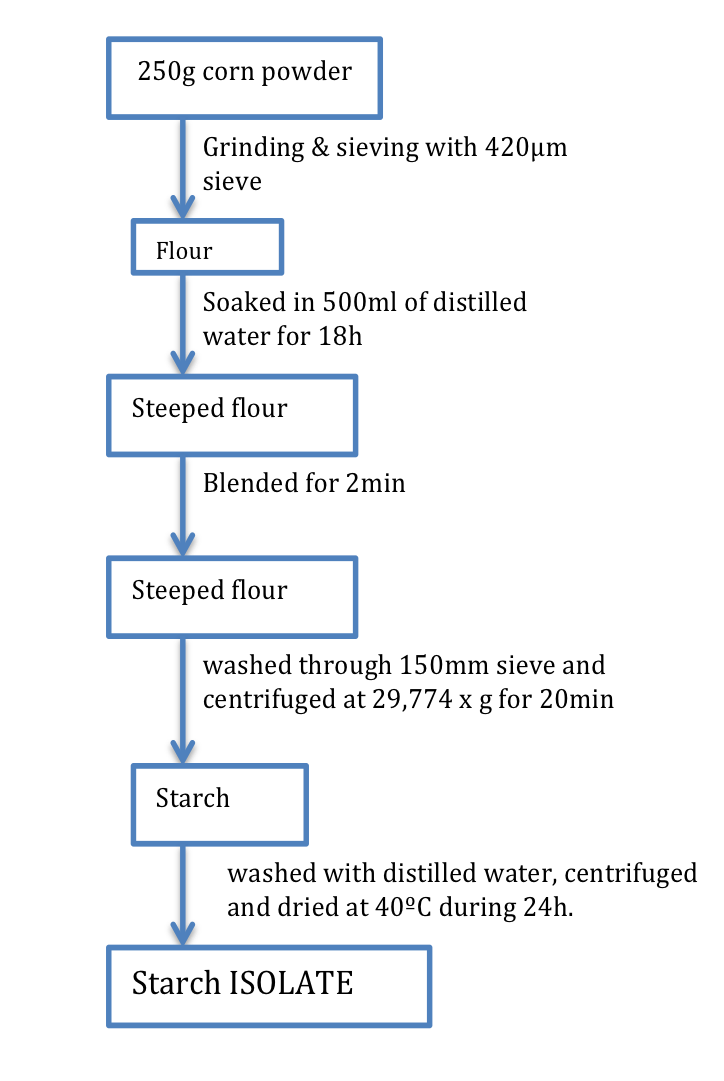
Fig. 1 : Flow chart for the water steeping method3.
2. Estimate the relative amount of amylose
The most frequent method used to determine amylose content is amylose-iodine colorimetry performed using a spectrophotometer. Linear amylose produces a deep blue complex when reacting with iodine. That chromophore can be easily monitored by light absorption spectroscopy. The method we propose is a colorimetric measure performed on a starch-iodine solution where the spectrophotometer will be replaced by a color chart. That will enable us to classify the AC into 5 categories. This method has been proposed by two different authors1,2. The main difference is the nomenclature (Munsell notation or RGB values & Hex codes) used to label the five categories (colours) that correspond to 5 ranges of AC.
The method used to prepare the amylose-iodine solution is the same for both cases: 100mg of starch were added to 100ml of water. To 5ml of that solution we added 1ml of 1M acetic acid and 2ml of 0.2% of iodine solution. Distilled water was added to make a 100ml solution.
Alternatively, in case of having a color meter we can use a multiple variable regression model proposed by Avaro et al.1 that relates the intensity of lightness, the amount of blue and the amount of green recorded with the color meter.
1Avaro, M.R. A. and Pan, Zhongli and Yoshida, Tomohiko and Wada, Yoshiharu.2011.Two Alternative Methods to Predict Amylose Content of Rice Grain by Using Tristimulus CIE Lab Values and Developing a Specific Color Board of Starch-iodine Complex Solution in Plant Production Science. 14(2):164-168
2 Avaro, M.R. A. and Tong, Ly and Yoshida, Tomohiko.2009. A simple and low-cost method to classify amylose content of rice using a standard color chart in Plant Prod. Sci. 12(1): 97-99
3 A.J. Palacios-Fonseca,b, J. Castro-Rosas, C.A. Gómez-Aldapa, T. Tovar-Benítez, B.M. Millán-Malo, A. del Reald and M.E. Rodríguez-García. 2013. Effect of the alkaline and acid treatments on the physicochemical properties of corn starch in CyTA Journal of Food 11(1):67-74