Blog posts

Automatic electricity readings

There are some good news in this area. We started collecting automated readings for computer room electricity meters about a year ago and spent quite a lot of time getting all measurements collected, consolidated and reported consistently. There were some issues or faults with individual meters but now we have three months of good quality data for January, February and March.

  Automated, KWh Manual, KWh Delta
January 2012 734,837 737,441 0.35%
February 2012 713,862 713,032 -0.12%
March 2012 784,304 784,914 0.08%

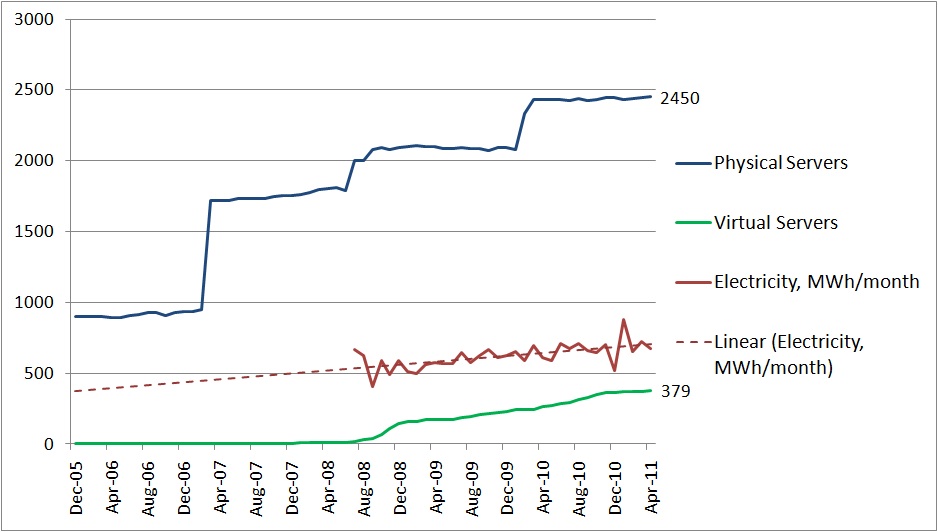
The data matches manual readings and also gives readings at 30 min intervals throughout the day. Now when automated data can be trusted we can use the data for environment Dashboard to link energy consumption and service metrics. I started looking into service metrics that can represent demand for resources – number of servers, number of applications, number of systems etc. and ways of publishing a monthly report which we aim to distribute to ICT and systems owners. We do this for PCs to raise awareness and it makes sense for servers too.

EU Code of Conduct submission

It was quite a while since the last post. During that time we had a few changes in scope due to College construction projects that were planning to move computer room chillers onto the roof of the Mechanical Engineering building and installation of additional fan units co-located with existing ones. As a result our scope and priorities were reviewed and we tendered for the following work:
1 Lighting in ICT suite
2 “Cold aisle” installation
3 Control units and adjustments to operations
Free cooling option we originally scoped for the project will be pursued via a different estates project which will replace one of the chillers. Once we receive final detailed quotes we can publish the original Statement of Requirements and an updated benefits summary.

In parallel to this, we are also working towards fully automated meter reading collection and reporting. More on this in the next blog.

Undefloor airflow

As part of baselining energy consumption and cooling performance Shiang Chin, 4th year student at Imperial College London, helped with measuring computer rooms airflow.

He measured airflow and temperature above each perforated tile and re-adjusted dumpers to maximize the overall airflow. There is a variance across the tiles due to undefloor obstacles which are not easily movable. Once the project “cold aisle” and “free cooling” tasks are complete we can re-assess and review how airflow changed and whether it needs re-adjustment. 
On the graph X axis is a tile number (from 503, entrance, towards 535, the rear of the room). Thanks Shiang!

Measuring air flow Measuring air flow graph

Thermal imaging of dampers

From the preliminary investigation we also found that temperature ranges emanating from the floor grilles indicate different temperatures. Prompted by this we’ll set a project task to adjust dampers correctly using anemometer/temperature probe and set a baseline. It will also be included this into regular checks and maintenance procedures.

Image of aisle airflow dampersThermal image of aisle airflow dampers 1Thermal image of aisle airflow dampers 2

Thermal imaging of cabinets in the trial area

Image of racks with and without blanking

ABS Consulting have conducted preliminary thermal imaging of some cabinets in the trial area and there is a very visible difference between a cabinet that has no equipment installed and has no blanking and a cabinet that has equipment installed with the gaps blanked off. The images highlight the mixing of warm back into proposed cold through the open cabinet. Temperature diffference can reach 8oC.

Thermal image of racks with and without blanking

Kevin Cope, Head of Building Operations at Imperial College, shares his thoughts:

The challenge of this particular project is to improve on what is already two reasonably efficient “data centre” computer rooms (with power utilization efficiency, or PUE, of 1.52 and 1.32), and perhaps influencing other “data centres” to adopt any improvements we can establish.

Working within Facilities Management I’m learning a lot about how such facilities function and their potential influencing factors, but one single fact suprises me and it is this:
We have a central “data centre” facility which is well supported, backed-up, environmentally controlled with excellent support staff, and this must be the most efficient, sustainable and cost effective approach to managing large quantities of data storage or processing, yet there is still a myriad of smaller “data farms”, “clusters”, which academic groups maintain, scattered around our College buildings. Such facilities require local focused cooling, additional maintenance and support, surely this doesn’t make sense and is certainly not the most efficient and sustainable solution!

Where do we start?

To start with the project we should establish a baseline and make an assessment of available options:

Two Imperial College computer rooms, which host around 2,500 servers for Imperial College London, Natural History Museum, Royal College of Music and Janet-LMN point-of-presence, consume about 7,500 MWh annually at a cost of around £500,000. Computer rooms housed in a traditional 1960’s building and there are design considerations and constraints to be taken into account. There is also a computer room in level 2 of Huxley which is assumed to consume around a third of the energy of the Mechanical Engineering computer rooms but this room is out of scope for the project.

Virtualisation has helped to contain the growth in power consumption of Business servers but step changes in adding more High-Performance modules and Research servers resulted in a steady increase. Here is the graph to show number of computer rooms server units (includes High-Performance modules, Research and Business servers):

ME Computer Room servers vs Power Consumption

We would be looking at 5% reduction of annual energy consumption through the use of the following options, or their combination:

  • Organise “cold aisles” and evacuation of hot air from “hot spots”
  • Energy recovery system, free cooling
  • Temperature adjustment of computer room AC units
  • Adjustment of other parameters of AC units
  • Smaller UPS unit
  • Improved solar radiation control (windows films/coating)
  • Improved air/coolant flow (filters, fans, pipes, ducts and ductwork)
  • Improved lighting control (to be able to switch on and off selected areas only)
  • Improved energy efficiency of lighting devices themselves
  • Electrical mains transformer efficiency improvement
  • Mains voltage adjustment (if feasible)

We believe those marked in blue should be looked at in more detail and assessed first. We would like a payback within 3 years which sets the total budget for the project to around £90,000 which includes £22,350 of JISC funding.

Annual Electricity Bill for Computer Rooms

Computer Room Efficiency Improvement project

JISC logoWe see more and more that issues of sustainability appear on Higher Education agendas. And rightly so. Energy consumption is probably one of the largest single expense in Estates and ICT budgets. Recognizing this JISC have started the Greening ICT Programme and we were very keen to take part in it. It could not be timed any better – with tighter budgets and pressure to reduce long-term costs there are opportunities and drive to do more within public organizations.

Imperial College runs a Carbon Management initiative which has a separate project, Computer Room Efficiency Improvement (project no 24), and decided it had a very good match to the objectives of Strand II of the Greening ICT Programme and it would be a good opportunity to submit our proposal and jointly fund the project. And now, with funding available, we are in a position to start the project.