
Google Analytics is a very powerful tool which tracks how people interact with the pages they visit, this includes:
- which pages they go to
- how long they spend on them
- where they came from i.e. did they use a search, type a web address in directly, click on a link in a newsletter etc.
- what type of device they used
- where in the world they were
and much much more.
Google Analytics records hundreds and hundreds of types of information that you can combine to build a picture of how people use our websites. Having access to all this data can be overwhelming and most of you won’t have the time (or patience) to trawl through it all. We just need a few pieces of information to help us understand how our site is performing.
In this post I’ll explain some of main metrics to look out for and how you should interpret these to inform your content decisions.
Analytics dashboards
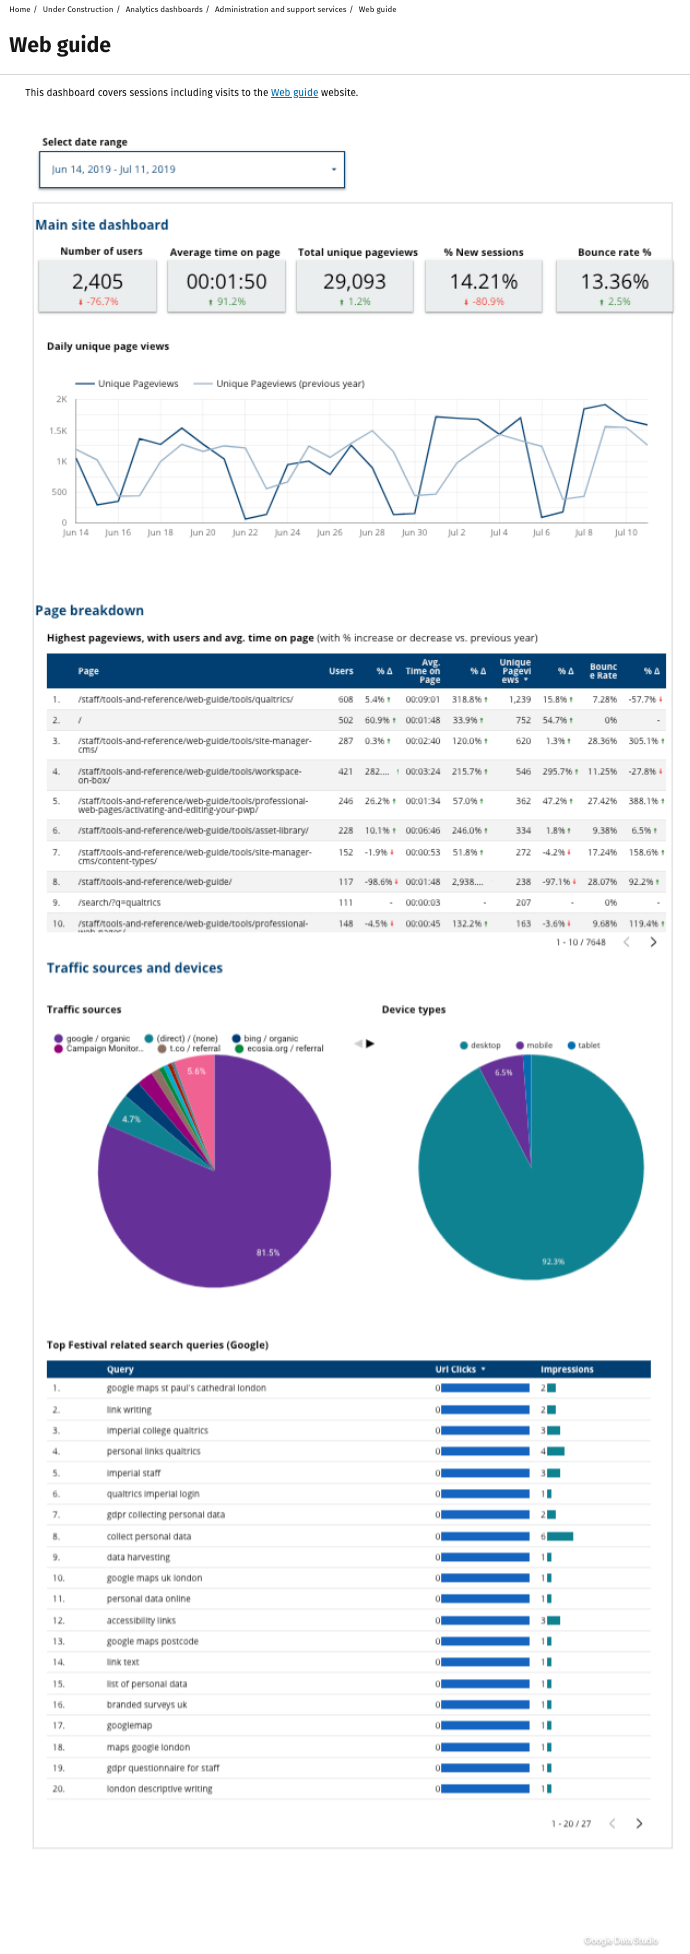 The Digital team is working with the Faculty Web Officers to create dashboards based on Google Analytics and search data. This gives editors quick and easy access to website reports without the need for Google Analytics expertise or a maths degree! An example of one of these dashboards is shown to the right.
There will be more about these dashboards and how to get one for your website(s) in July’s College editor newsletter, so watch this space!
Interpreting your analytics
Ok, so you have access to Google Analytics or a dashboard, so what are the main things you need to look for? and what do all these numbers mean?
Visits and engagement
Number of unique pageviews: This tells you how many distinct visitors there have been to a page during the specified time period. This is a better indicator of visits than pure pageviews as it doesn’t include duplicate visits and bots.
Time spent on the page: This gives an average time of all the visits to the page or website. There will be some bot traffic mixed in with this, but it is still a good indicator of user engagement.
Bounce rate: this shows a percentage of the visits where that page was the only one they visited. You have to be careful with this metric because a high bounce rate may not always be negative. For example, if you have a piece of communications which points someone to a single page, they may just visit that single page and leave the site.
Search queries: search data is a really important thing to look at. The majority of traffic to the College website is via search, so understanding the terms or queries people use to access your pages is really important for the following reasons:
- It helps you understand the language your visitors use. Incorporating this language into your content will really help to make the content understandable and easy to find and navigate.
- If there are really common search terms then you can request a promoted search for the internal website search. Once set up, your page will appear at the top for any searches for that term.
Other tools for analysing search trends
As well as Imperial search data, it is also worth considering other tools when looking at the words and phrases that people use. Google Trends is a great resource for this as it looks a wider search trends, not just those pertaining to Imperial. AnswerThePublic is another useful tool for this. It utilises the data from several search engines to give you the most popular search phrases based on a keyword. This is basically a report of the autocomplete suggestions you get when you start typing a word in Google.
Traffic sources and devices
Traffic sources: this tells you how people got to your website, and is particularly interesting if you use any marketing or promotional channels. For example how your newsletters, social media channels are performing compared to search and direct traffic.
Devices: this will tell you what proportion of your visitors use desktops/laptops, tablets or phones to access your website. When making decisions on content and layout, you should consider trends. For example, if you are seeing a growing number of your visitors are using mobiles, then you should think about the mobile user experience when creating your content or deciding on layout. This might include where your call to action buttons or key messages go. On T4, sidebar content appears at the bottom of the page on a phone and highlight box content appears right at the top.
Combining metrics to aid decisions
Trying to determine user engagement
Engagement is something that is always hard to measure, but there are a few metrics that can be combined to give you an indication. One of the simplest things to do is to look at the unique pageviews and bounce rate alongside the time spent on the page. If you have a page with a low number of views, a high bounce rate and the average time someone spends on the page is low, then it is likely users are not finding this page useful.
You can strengthen this case further by assessing the readability of your content using tools like Readable or Hemingway which will give you the number of words, readability score and estimated reading time. For example, a page may have these stats:
- There are 1,200 words
- It should take around 5 minutes to read the page
- There have been 10 pageviews in the last 6 months
- The average time spent on the page is less than 20 seconds
- The bounce rate is over 80%
This is a fairly extreme example, but you can clearly conclude that engagement with the page is very low – there is quite a lot of content, but very few people are looking at it, and those that are, are not reading it. In this case, the most obvious action is to delete this page. You could also consider other actions such as rewriting or raising the profile of the page in search results and discoverability from the homepage of your website.
I hope that gave a you quick insight of how Google Analytics can really help you when managing your content. If you need any advice on Google Analytics then contact your Faculty Web Officer or email me. I have also included some useful resources below.
Useful resources
- Google Analytics guidance on the Web guide
- Video: In Analytics, What do the Numbers Really Mean? Katie Sherwin, Nielsen Norman Group (YouTube)
- Glossary of Google Analytics terms
- Interpreting Google Analytics (Ocreative design)
- Web marketing: How to interpret bounce rates in Google Analytics (dummies.com)
- Data and analytics (GOV.UK)