Tests for White Noise
 

A wavelet based test for white noise

The paper "White noise testing using wavelets", by myself and Delyan Savchev, was published in STAT (2014).

The basic idea behind the new test is as follows. White noise has a flat spectrum and its periodogram values are asymptotically distributed as exponential random variables with a constant mean (for a wide range of distributions, collections and situations). The famous Bartlett test applies the Kolmogorov-Smirnov test to the cumulative periodogram. Our test looks at the wavelet coefficients of the periodogram directly. von Sachs and Neumann (2000) used this idea for stationarity testing by examining the constancy of a time-varying periodogram over time, whereas we examine constancy over frequency. Our test can also use smoother wavelets in an attempt to obtain greater power. All the wavelet tests examine wavelet coefficients of the periodogram to see if any are significantly different from zero. This is done by using accurate approximations to the coefficients' distribution and methods of multiple hypothesis testing.

The R package, hwwntest, available on CRAN, contains these new tests and an implementation of Bartlett's test of white noise (based on helpful notes by H. Joseph Newton).

The statistical power of the test?

For some specific alternative hypothesis: what is the power for my test of white noise?. A general theory for this power for an arbitrary alternative seems out of reach for most tests and software implementations non-existent (? if you know of any, please let me know).The hwwntest package contains genwwn.thpower that computes the approximate theoretical power for the package's general wavelet white noise test (genwwn.test) for (power of two) sample size for any ARMA process.

Plotting power versus sample size

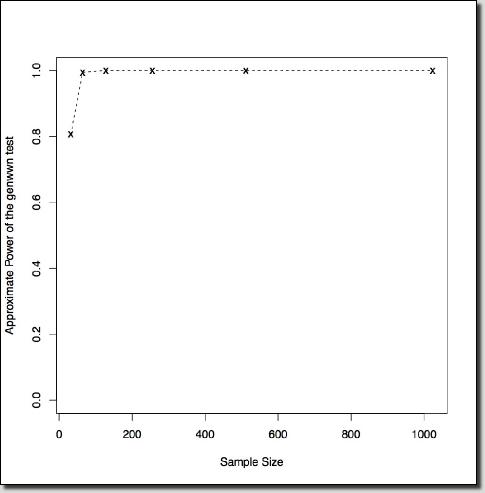
The plot above shows the power of the genwwn.test against sample size for an AR(1) process with parameter α =0.8 generated using the command

genwwn.powerplot(ar=0.8)

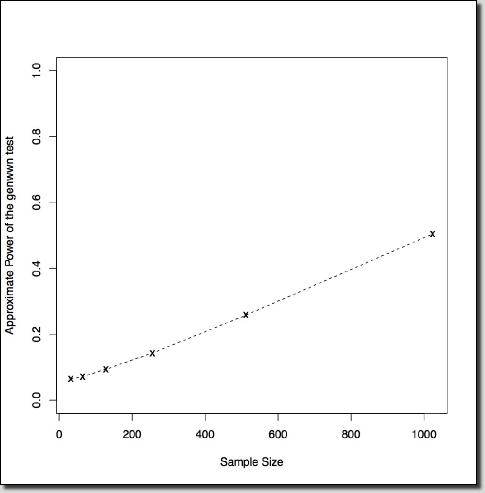
The crosses indicate for which sample sizes are actually calculated. The power is very high even for small sample sizes. The plot to the right was obtained by setting ar=0.1. Even for the large sample size of N=1024 the power is only 50%.

Why is this important?

You often see analyses where people are estimating small AR parameters with small sample sizes and this can be unrealistic. You often really do need a large sample size to detect and estimate small AR parameters.

genpower08
genpower01