Network Time Series

Trend Removal, Decorrelation, Network Lifting

Background

Network Time Series are data sets which comprise a multivariate time series augmented with a network structure. Often the multivariate time series describes the evolution of a set of values observed at the nodes of a network through time (although sometimes values will be observed at the edges too, or both). Network Time Series differ from other multivariate time series as the network structure influences the model and networks through time can be dynamic and the models have to cope with this (and benefit from it).

Click here for a recent paper on Network Time Series (models, detrending, theory) and here for an even more recent one

Click here for an older article on how network lifting can be used to decorrelate network time series and help with forecasting.

For an article on multiscale tranforms on networks: [Tech Report][Published]

Network Software

NetTree: an R package for the wavelet (lifting) transform on a network.

PicTree: for network guided wavelet analysis but for data with coordinates.

GNAR:Methods for Fitting Network Time Series Models on the CRAN archive.

Mumps Network Time Series Example

The figure below shows the number of cases of Mumps measured in counties of England and Wales during the first and last week of 2005 as part of a larger set containing data for every week in this year. This data was kindly supplied by Daniela DeAngelis and Douglas Harding of the UK Health Protection Agency. In this form it is a multivariate time series.
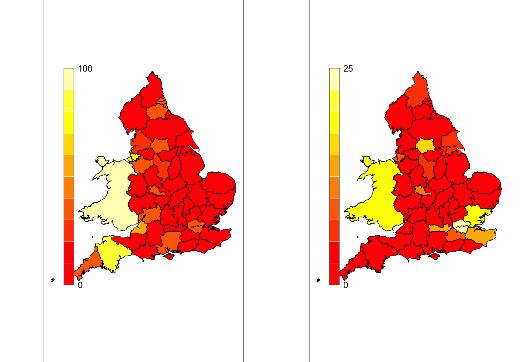
efpres1

However, we know that counties are linked. For example, what happens in Somerset might influence what happens in Devon, much more than what happens in Yorkshire (for example). Hence, we can endow the multivariate time series with a network structure such as the one in then next figure.
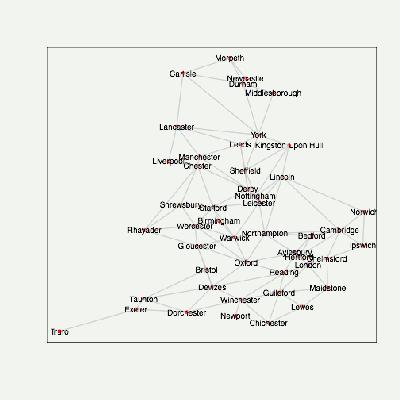
efpres2

This network structure can be used to provide interesting new time series models for the data, to detrend it effectively, decorrelate (similar to network inspired principal components analysis) and to aid with forecasting the evolution of the disease.

© Guy Nason 2020