I’m mainly posting this because I’m getting tired of explaining it repeatedly! There are plenty of other better written articles about this topic but they don’t make the combination of points that I would like to make. This post is about correlation, and what you can and can’t use it for. More generally it is about being careful about drawing conclusions from data.
It is very easy to jump to conclusions when we see changes in the world around us. For example, you might be looking at the success of a particular vaccine in protecting populations from a particular disease. Let’s say that in the countries where the population is given this vaccine, the disease levels are lower. Is the vaccine effective? The answer is maybe. it could just be a coincidence. With this amount of information, we don’t know. It could be that the countries that can afford to provide the vaccine are richer, and those people are less susceptible to the disease because of improved nutrition. It could be that people in those countries have a natural immunity for some reason. Determining whether the vaccine is effective would require a much more carefully designed trial in controlled conditions.
Noticing a connection between two datasets like this is an example of a “correlation”. Correlations are particularly easy to plot in data which is changing over time, i.e. time series. For example, a government may make some kind of change in crime policy, say increasing the minimum sentence for burglary. Suppose that burglaries then fall over the next 5 years. Is the policy working? Maybe, but we don’t know from this information alone. The number of burglaries could depend on a range of factors, including changes in policing, the state of the economy, recreational drug policy, the changing risk/reward balance of other types of theft, etc. Without more careful trials, the fall in burglaries doesn’t tell us anything. Not a thing.
There is quite a bit of confusion about this. Most people have been told that “correlation does not imply causation” i.e. spotting a pattern between two datasets or time series does not prove that one thing causes another. However, I still hear people making the argument “I know that correlation does not imply causation, but …”, i.e. they know that a causal link is not certain, but they are saying that the correlation is adding to the evidence that the causal link may exist. The point is, correlation does not add to the evidence at all, unless all other factors have been painstakingly removed in a controlled environment.
When I try to explain this, people often say “ah, but in the real world, we have to make a decision based on a lower standard of proof”. This is true, criminals can be convicted “beyond reasonable doubt” which is definitely short of absolute certainty such as you get from a mathematical proof. And, in most civil cases, the “balance of probabilities” is the standard. However, that does not mean that you are abandoning logic. It just means that you are making a decision to convict if there is sufficient probability (the exact amount depending on the situation) that the crime was committed. It is the job of judge and jury to try to estimate this probability (assisted by experts and usually not quantified as a number!). And my point is that not only does a correlation between two datasets not prove that A causes B, it does not even increase the probability that A causes B by any amount. This is because using correlation to prove causation, or even to increase the probability of causation, is a logical fallacy.
I’ll illustrate this with some graphical examples. I’ve simulated a time series of a quantity X, illustrated below. Let’s say it is the price of corn in Dakar (it isn’t).

I’ll now take each value of X, multiply by 2, and add 10, and call that Y. This is plotted below.
We see that when X goes up, Y goes up, and when X goes down, Y goes down. This is because the value of Y is simply the value of X, scaled by 2 and shifted by 10.
There is a mathematical definition of correlation between two variables, given here (not necessary to understand this post) with notation Corr(X,Y). When Y is simply a scale by a positive number and shift of X, then Corr(X,Y)=1, the maximum value, and we say X and Y are maximally correlated. If Y is a scale of X by a negative number with a shift, then Corr(X,Y)=-1, the minimum value, and we say X and Y are minimally correlated.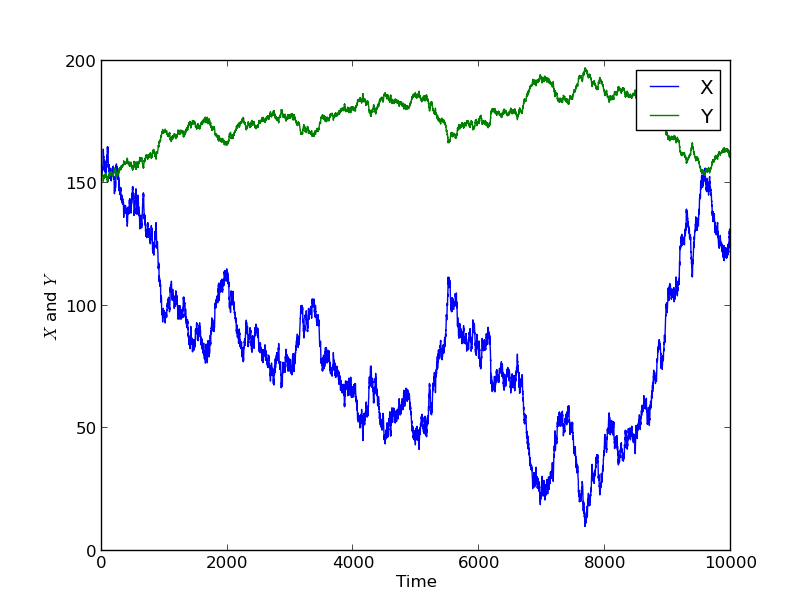
We see that Y now goes down when X goes up and vice versa. If I choose Y to be a more complicated function of X, for example each Y value is obtained by computing 10 log (X), then the correlation is lower.
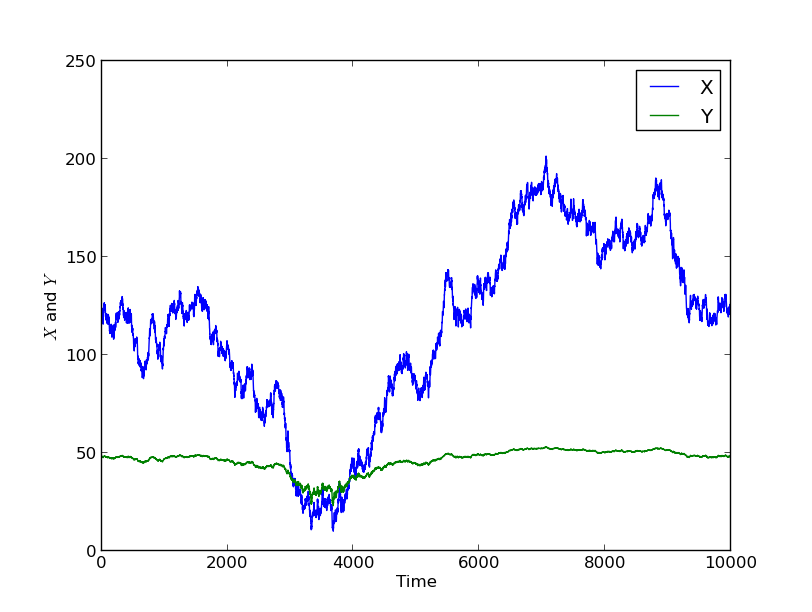
Notice that Y is still correlated with X in the sense described above, but here I computed Corr(X,Y)=0.948. This is because the relationship is not linear i.e. it is not just a scaling and shifting. The more “nonlinear” the relationship is, the lower the correlation is. If I try an even more complicated function, Y = sin(sin(X)), then I get Corr(X,Y)=0.055, a very low correlation, and the plot is shown below.
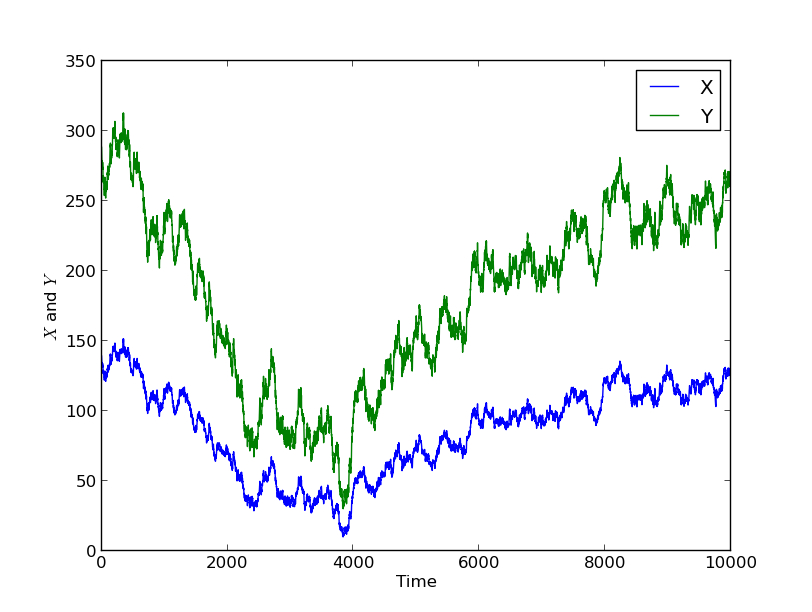
Another typical situation is that Y could be equal to X, plus some other random component which is smaller in magnitude (perhaps Y is also affected by another process, say the price of wheat in Moscow). An example of this is plotted below. Here there is some relationship between the data, and Corr(X,Y)=0.9.
Finally, I’ll simulate Y to be a completely independent time series, let’s say the popularity rating of the Madagascan president (it isn’t).

As it happens (I promise this is the first simulation I did, no cherry picking), there is quite a bit of parallel drift between these two time series, and the correlation is Corr(X,Y)=0.48 which is not too small.
The point here is that I have been building a causal link into this experiment. Each time, except for the last, I simulated a variable X, and then computed Y as some transformation of X. This means that X causes the change in Y, and we know this because I defined it like this. However, if you just look at my second graph, and even compute the correlation as a number, you have no way of knowing that X caused Y. I could just have easily simulated Y, and then obtained X by subtracting 10 and dividing by 2. It could even be that X and Y have both been computed from a third variable, Z, in which case Z causes the change in both X and Y.
Going further, in the case Y=sin(sin(X)), the changes in Y are completely caused by X, but the correlation is low because the causal relationship is complicated. The correlation also decreased when Y was partially caused by X, but also had some other independent variability. Finally, even when Y was completely independent from X in the final example, there still were some similarities in the data, and the correlation was actually much bigger than the sin(sin(X)) example.
So, what can we use correlation for? Well, if we have two independent processes (i.e. there is no causal link between them), then on average, their correlation will be zero. For the two particular processes I chose above in the last example, they turned out to have some correlation. However, if I had obtained longer data series, this correlation would be closer to zero. So if there is a lack of correlation on a large enough dataset, then you can rule out causation. To know how large is large enough, you need to ask a statistician (who will calculate for you the probability of the situation occurring by chance). If you have two time series or data sets X and Y that are correlated, all you have done is suggested a plausible hypothesis that X causes Y. You must also consider that Y causes X, or that there is a third factor Z that causes both X and Y. If you want to prove the hypothesis, or estimate the probability that it is true, correlation tells you nothing. You either have to eliminate all other plausible hypotheses, which is usually how proof is carried out in courts. If only the balance of probability is required, then it may be that only probable hypotheses need to be eliminated. In scientific research, if we are comparing different hypotheses, we usually seek a mechanistic process that explains how X could cause Y, and then try to calculate/estimate the probability that this could happen from theory or experiment (or a combination of the two). This probability must then be compared with other hypotheses before deciding the most likely cause.
If you are interesting in how you might prove (beyond any doubt whatsoever) that two independent processes have zero correlation on average, or you are interested in how I simulated these datasets (or both), then you might be interested in doing a degree in Mathematics at Imperial College London.